MACS Matchmaker
An evaluation turns the traces of one measurement into numbers: rate constants, an affinity, a detection limit, or a concentration. This page covers where each evaluation starts, the guided workflow they share, and how to read the result. The cleanup they consume is in Data Cleanup; the science behind the fits is in Interpreting Results.
Where an evaluation starts
Every evaluation runs on the traces of one measurement and is saved to a project. There are three ways in, and all three open the same guided wizard:
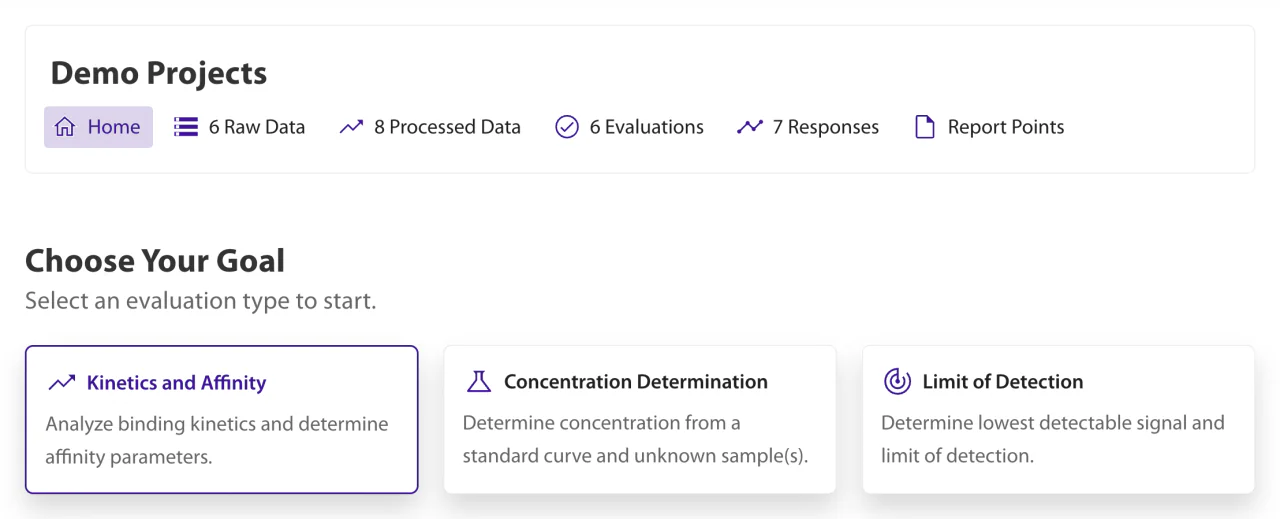
- The project home has one card per goal — Kinetics and Affinity, Concentration Determination and Limit of Detection. Each card starts the wizard for that goal.
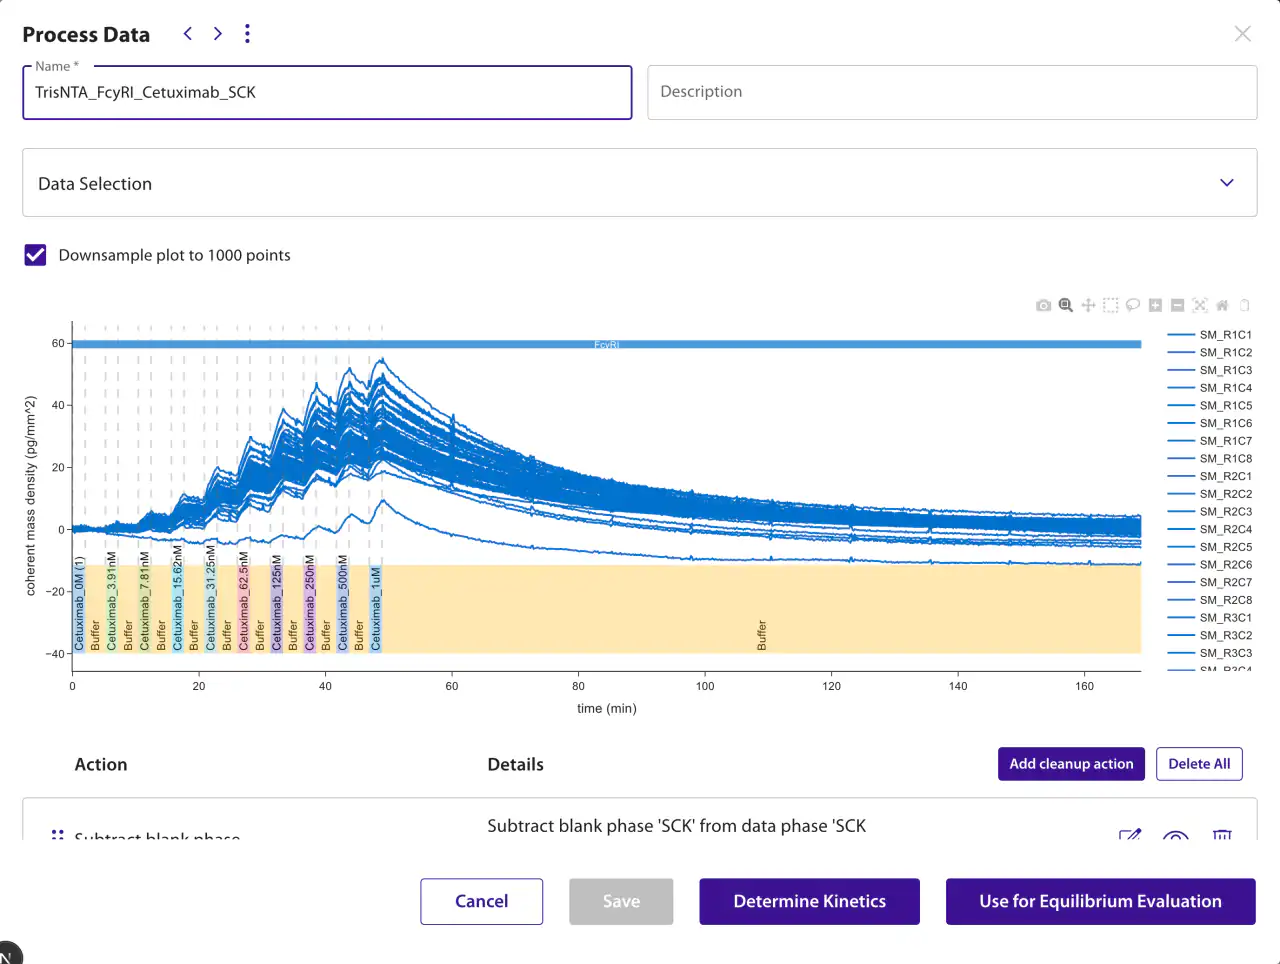
- The Process Data dialog offers an action per evaluation the selected data is eligible for: Determine Kinetics, Use for Equilibrium Evaluation, Use for LOD Evaluation and Use for DEL Evaluation. Actions the data cannot support are not shown.
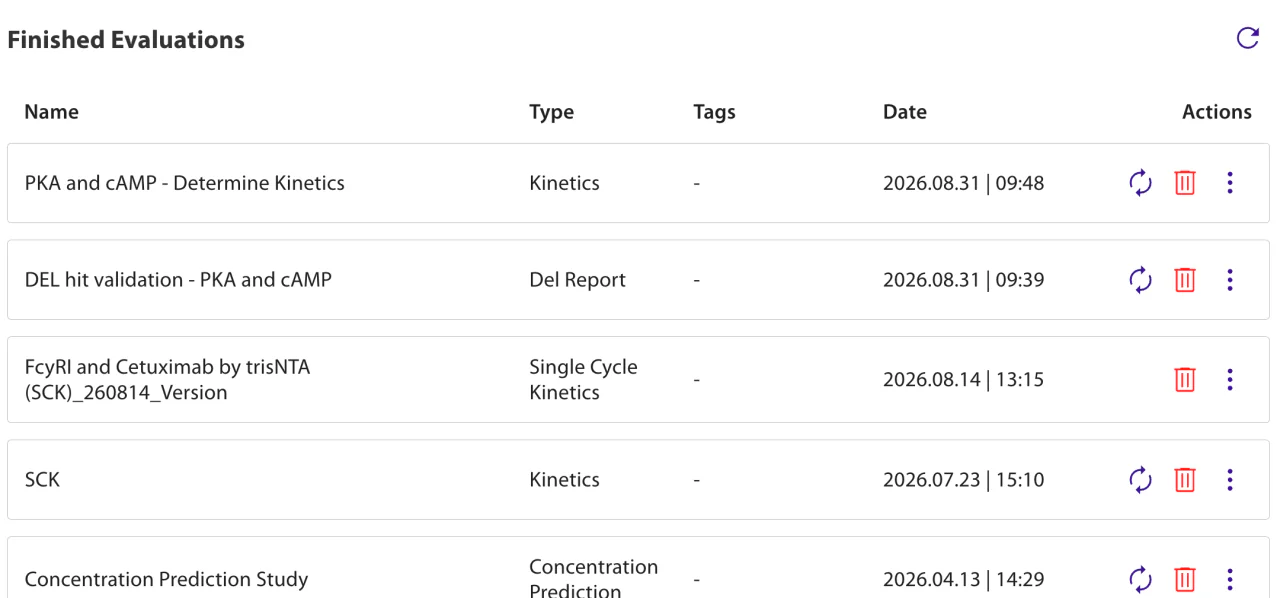
- The Re-evaluate action (the circular arrow) on a finished evaluation reopens the wizard on the data and settings that evaluation ran with.
Choose an evaluation
| Evaluation | Wizard | Data it needs | Primary result |
|---|---|---|---|
| Determine Kinetics | Kinetics and Affinity → Binding Kinetics | A concentration series, measured as a single cycle on a surface that keeps what it binds, or as cycles regenerated after each concentration | kon, koff and KD |
| DEL | Kinetics and Affinity → DEL | Multiplexed DNA-encoded compounds, one analyte | Accepted ligands and kinetic fits |
| Equilibrium | Kinetics and Affinity → Equilibrium Analysis | Steady-state responses over a concentration series | Equilibrium KD and Rmax |
| Limit of Detection | Limit of Detection | Low-concentration series with at least three blanks | LOD signal and concentration |
| Concentration Determination | Concentration Determination | Calibration series and matched unknown samples | Estimated unknown concentration |
The shared workflow
Every wizard walks the same steps, in the order the work happens. Which steps appear depends on the evaluation:
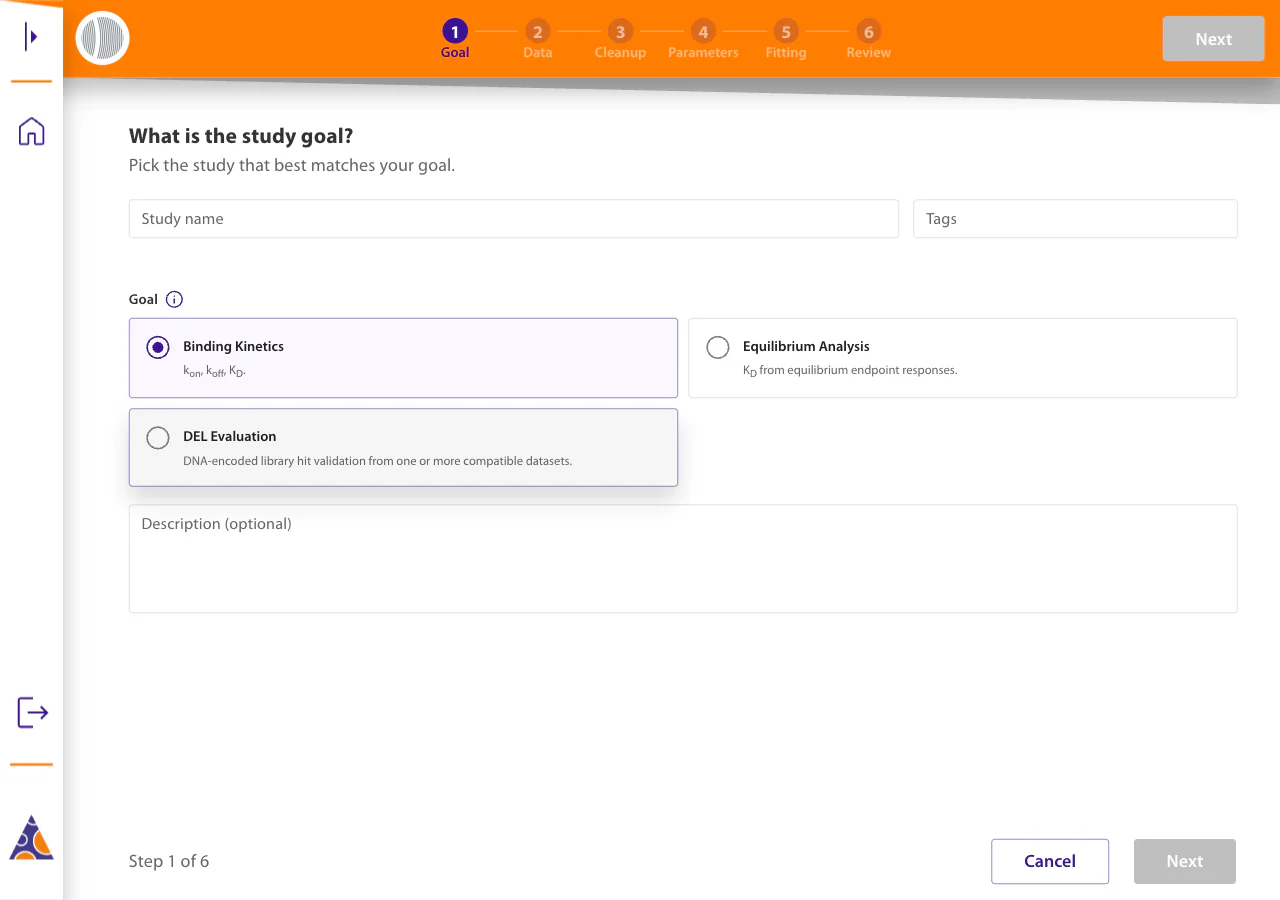
- Goal (Concentration Determination calls it Details) — name the evaluation, add tags, and for Kinetics and Affinity pick the study goal and mode. In Kinetics and Affinity, you can return to Goal to edit the name, description, or tags while keeping your selected data, cleanup actions, fitting settings, and fit decisions. Changing an existing data selection asks for confirmation if you have edited cleanup, fitting settings, data selection, or fit decisions. Loading defaults and moving between steps do not trigger this warning. Cancel keeps your current selection and settings.
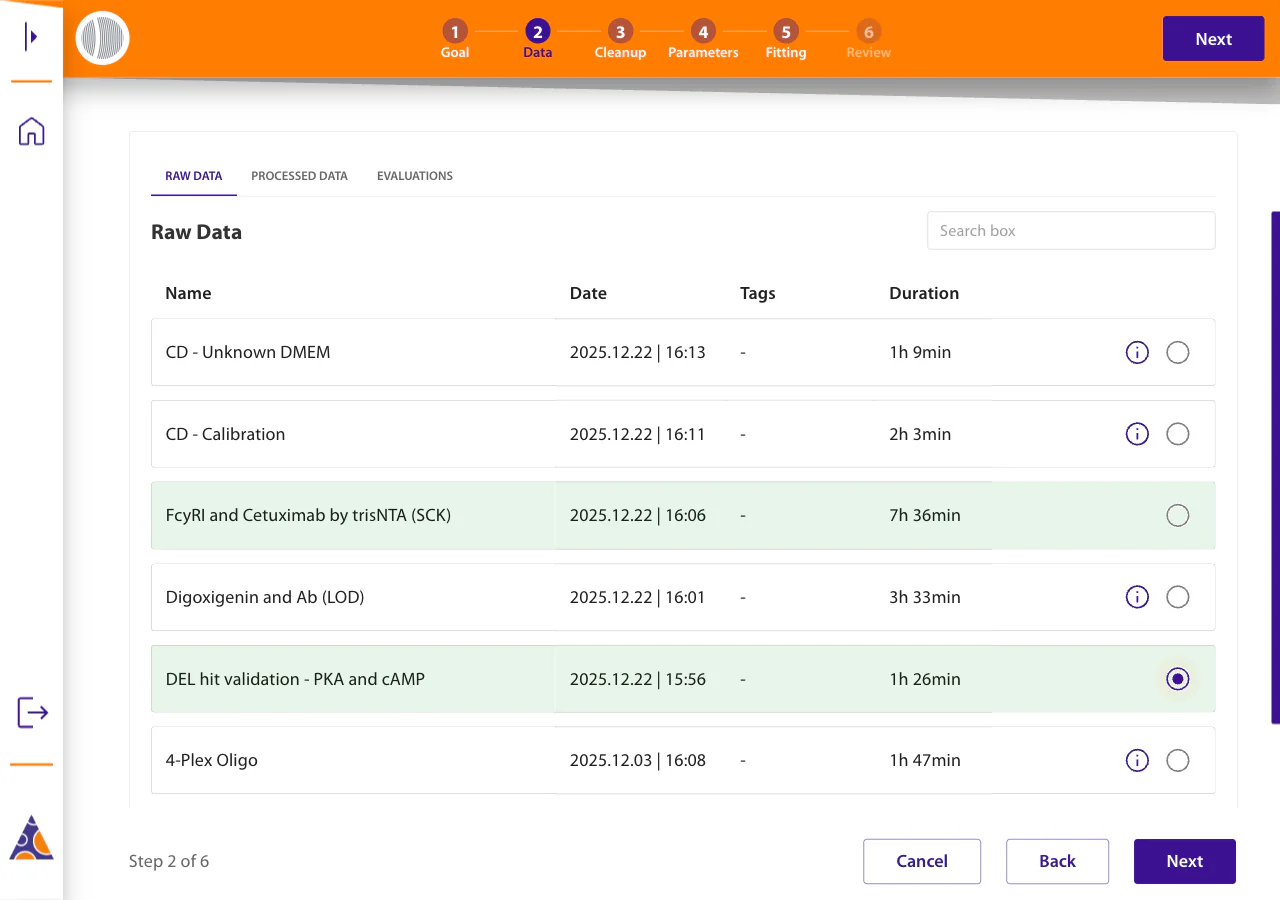
- Data — choose eligible raw data, processed data, or a previous evaluation. Eligible rows are marked; Add Raw Data to Project brings new measurements in. Each source tab offers search, tag filters, sorting, and list or tile views. Click a tile or its selection control to choose a dataset. Kinetics takes one dataset; DEL takes more than one dataset.
- Cleanup — the data transformations the evaluation will apply, shown as an editable list with a live preview. Starting from raw data, the wizard fills in the defaults that data supports; you can edit, reorder, add or remove any of them. See Data Cleanup for how the list works. DEL has no Cleanup step; its subtractions are parameters instead.
- Parameters — the fitting model and its options.
- Fitting (Determine Kinetics and Concentration Determination only) — inspect the per-mologram fits and accept or reject each one, or adjust the calibration, before the result is saved.
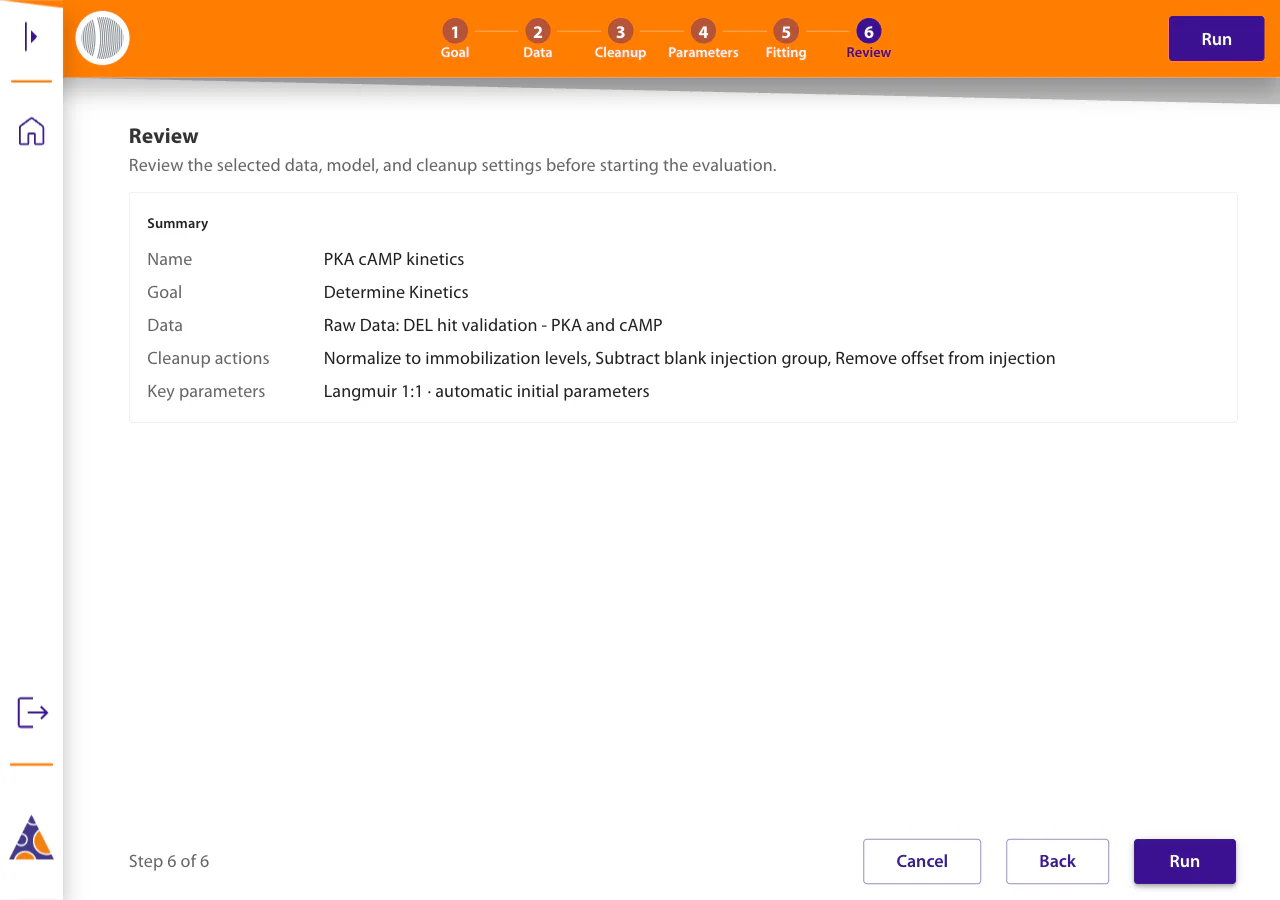
- Review — the data, cleanup and settings together; select Run (Concentration Determination saves instead).
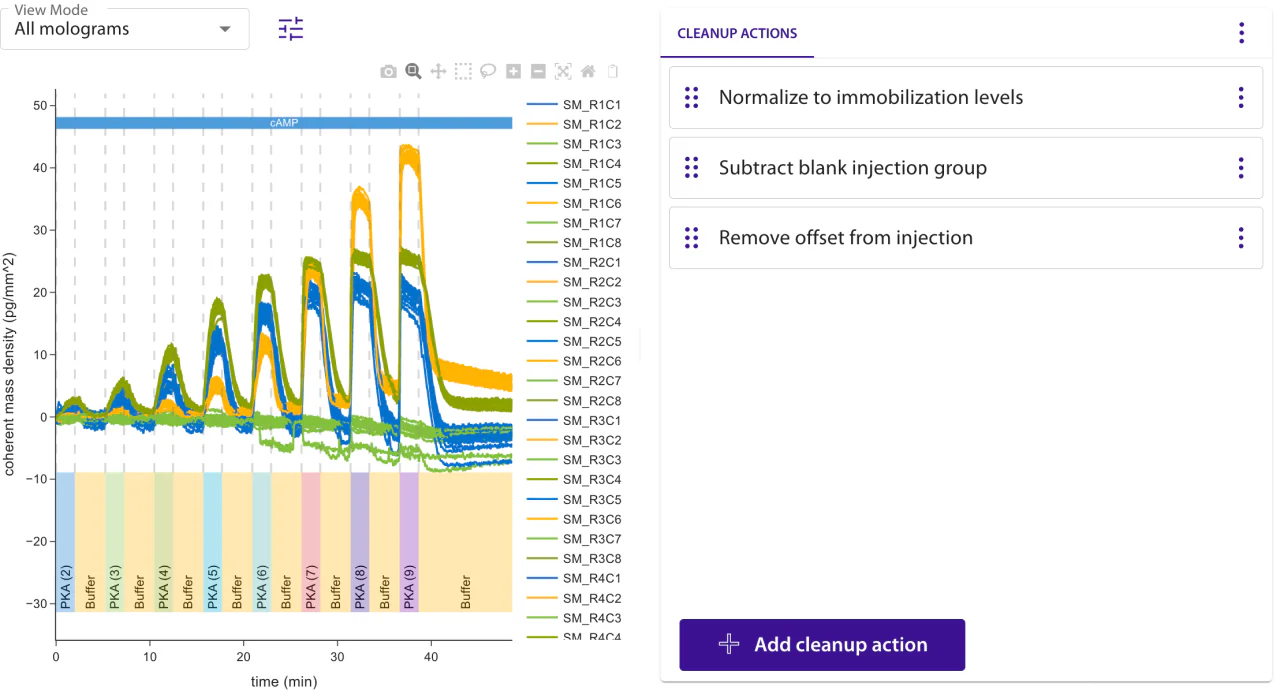
A cleanup action can be disabled to compare with and without it. Disabling is never saved, and it leaves the action out of the preview only — the evaluation still runs it. Determine Kinetics, Equilibrium and Limit of Detection therefore refuse to continue until every disabled action is enabled again or removed; Concentration Determination instead runs only the enabled actions. From the cleanup step's menu, Save as processed data stores the current list as a reusable processed dataset. Cancel asks before discarding changes. When the service is available, the Kinetics and Affinity wizard also carries an Evaluation Assistant that can explain model choice, data requirements and fit acceptance for the current workflow.
After you run it
Running an evaluation queues it. The Evaluations tab lists it under Ongoing Evaluations while it is Queued, Running or Failed; a failed run keeps a Failed Evaluation Logs entry. When it finishes it moves to Finished Evaluations, which you can search, Filter by tags and Order by, and act on in batches (move, export, delete).
A finished row's actions are Re-evaluate, Delete, and, under More actions, Show Evaluation Details, Edit, Download Evaluation Results and Move to Project. Open a row to see its findings, numeric results and plots; the result page filters by Hologram Identifier and by tag, and every plot, report and CSV the evaluation produced is listed for download.
Re-evaluate and reuse
Re-evaluate restores the original data, cleanup and parameters — and for Determine Kinetics, the accept and reject decisions — and proposes a versioned name (Version 2, then the next number). It opens on the Cleanup step, except DEL, which opens on Parameters. This differs from picking an existing evaluation in the Data step of a new wizard: that reuses the data and cleanup but returns the fitting parameters to the defaults for that data.
An evaluation whose result its saved data and cleanup can no longer reproduce has no Re-evaluate action. Equilibrium and LOD evaluations that cleaned their data automatically are among them. Start a new evaluation from the same data instead.
Determine Kinetics
Fits a concentration series for kon, koff and KD, one fit per mologram, each accepted or rejected before the result is saved. It reads the design from the data: a single-cycle titration on a surface that keeps what it binds, or a series regenerated after every concentration. Its cleanup, fitting and results are in Determine Kinetics.
DEL Evaluation
DEL evaluation validates DNA-encoded library hits by fitting a single-cycle kinetics titration against multiplexed DNA-encoded compounds. Response-to-immobilization thresholds remove weak ligands and sensors before kinetic fitting.
Configuration
| Setting | Meaning | Default |
|---|---|---|
| Threshold Ligand | Minimum ligand median response-to-immobilization ratio, relative to the strongest ligand. A higher value rejects more weakly responding ligands. | 0.2 |
| Threshold Individual Sensor | Minimum sensor response-to-immobilization ratio, relative to the strongest sensor. A higher value rejects more low-response sensors. | 0.1 |
| Auto Data Cleanup | Applies the selected blank subtractions before filtering and fitting. A subtraction whose blank the data does not contain is skipped, and that input passes through unchanged. | Enabled |
| Subtract Blank Phase | With Auto Data Cleanup on, finds phases with matching single-cycle injection structure, treats the phase with the lowest total response as the blank, and subtracts it from the phase with the highest response. Needs at least two compatible phases. | Selected |
| Subtract Blank Injection Group | With Auto Data Cleanup on, uses the first blank injection group in each single-cycle sequence as the reference, subtracts it from later target groups whose dissociation is no more than 10% longer, removes the blank group, and reconnects the trace. | Selected |
| Subtract Blank Molograms | With Auto Data Cleanup on, averages the traces of sensors without an immobilized ligand and subtracts that average from every ligand-bearing sensor. Blank sensors are removed from the sequence. | Selected |
| Reduced Chi-Squared Stickiness Threshold | Classifies a ligand as sticky from the median high-concentration off-rate fit and selects the partially non-dissociative 1:1 model. A lower value classifies more ligands as sticky. | 5 × 10⁻⁴ |
| Reduced Chi-Squared Fit Quality Threshold | Rejects a sensor fit at or above this dimensionless value. A lower value is stricter. | 1 × 10⁻² |
Which blank each subtraction uses
- Blank phase — found automatically among phases sharing the single-cycle structure: the one with the lowest response is taken as the blank, the highest as the data. Applied to the whole measurement before DEL processing.
- Blank injection group — the blank group paired with the group being evaluated. Applied later than the other two, on the extracted single-cycle sequences rather than the full measurement, so it matches how the kinetic pipeline subtracts.
- Blank molograms — the molograms marked as non-binding or reference. Applied to the whole measurement before DEL processing.
Read the result
- The findings report how many ligands and sensors passed the response and fit-quality gates. Rejected entries retain their reason.
- Accepted sensors contribute kinetic parameters and ligand-level summaries. Inspect their fit and residual plots before ranking hits.
- Response, immobilization, sequence, compound, per-sensor fit and off-rate plots are generated when their required data are available.
- A ligand classified as sticky is fitted with the corresponding partially non-dissociative model; that classification describes this measurement and should be checked against replicate evidence.
Equilibrium Evaluation
Equilibrium analysis estimates KD from plateau responses rather than the time-course. See Equilibrium Evaluation for data requirements, configuration and result interpretation.
LOD (Limit of Detection) Evaluation
LOD estimates the lowest analyte concentration distinguishable from blank measurements. It runs on a low-concentration series with blanks. For assay setup, see Assay Setup → Limit of Detection.
Select the series, review its cleanup, and configure the response and fitting window. If a measurement contains several consecutive LOD series, each is analyzed separately; use Keep only within time interval to restrict the evaluation to one.
The Cleanup step proposes applicable blank-phase, blank-group and blank-mologram subtraction as editable cleanup actions. Review, change or remove them before continuing. Use Apply default cleanup actionsin the cleanup menu to replace the list with defaults for the current selection. Processed data with existing actions and saved evaluations open with their stored cleanup.
Continuous titrations first group each association with its preceding baseline or rinse in Cleanup Actions. Default blank-group subtraction averages the blanks within each series and retains their residual signals for the noise estimate. Baseline alignment and titration grouping are required parts of the LOD calculation and run after the selected cleanup actions.
Configuration
| Parameter | Purpose |
|---|---|
| Input Unit | Molar concentration uses the analyte concentrations stored with the measurement. Stock percentage converts each injection's dilution factor to a percentage of undiluted stock, where a factor of 1 is 100% and a factor of 2 is 50%. Blanks use a dilution factor of 0. LOD requires at least three distinct values in the selected unit and three blank samples. If all dilution factors are 1, every injection counts as 100% stock, even when molar concentrations differ. Use Molar concentration for such data. |
| Number of concentrations in fit | Lowest-concentration points used for the linear regression (default 4, range 2–20), counted after skipping concentrations whose mean response sits within 3σ of the blanks. |
| Response Mode | Endpoint uses the response near the end of each injection; Initial Slope fits its initial binding rate. |
| Response window | Percentile fields define the endpoint window or the baseline and slope windows, depending on the response mode. |
| Fix Origin Through Median of Blanks | Holds the intercept at the median blank response. Use this when the blank median is a justified zero reference; otherwise a fixed intercept can bias the calibration. |
Calculation and results
Three blanks are the minimum. The evaluation refuses to run on fewer and names the count it found — three is what it takes to estimate the noise the detection limit is measured against.
A blank is any point in the series at zero concentration. They are collected per mologram, across that mologram's injections, and never pooled across molograms.
For each mologram, the lowest detectable signal is mean(blanks) + 3.2 × σ(blanks), where σ is the population standard deviation. The linear fit through the low-concentration points converts that signal into a concentration: (signal − intercept) ÷ slope. The reported LOD is the median of the per-mologram values, and the reported 95% CI is the 2.5th to 97.5th percentile of those per-mologram values — a spread over sensors, not a fit uncertainty.
The result contains the LOD concentration in the selected input unit (nM, or a percentage of undiluted stock), lowest detectable signal, linear-fit parameters and confidence intervals, plots, per-sensor results and a CSV export.
Concentration Determination
Concentration Determination fits a calibration series and interpolates matched unknown samples only within the retained calibration range. See Concentration Determination for model selection, exclusions, dilution agreement and result interpretation.
Response plot units
Evaluation plots use the selected response quantity. Normalized responses are dimensionless (normalized (a.u.)); coherent mass density is reported in pg/mm².
Read the findings
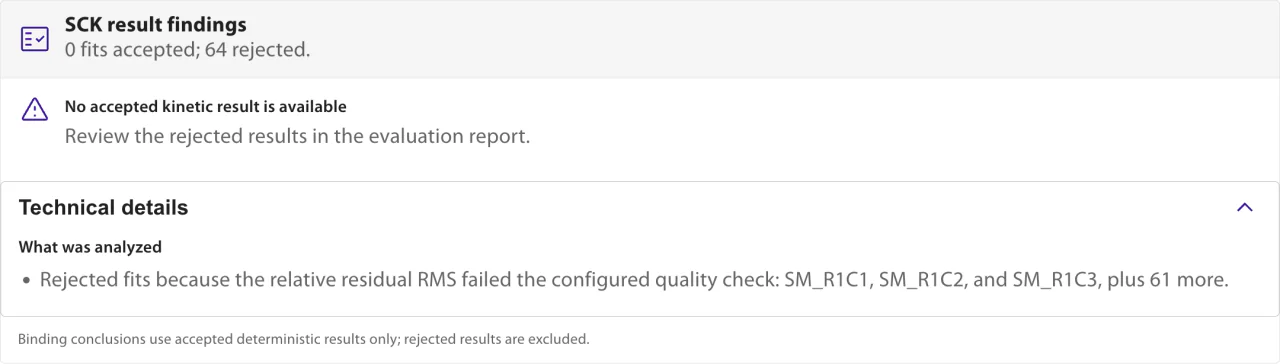
Determine Kinetics, DEL and Concentration Determination open with a summary derived from the evidence saved with the evaluation. Equilibrium and Limit of Detection do not produce findings.
- The findings report accepted and rejected fits, ligands or unknowns; conclusions use accepted results only.
- They identify the model and qualify rates or affinities that the data could not resolve.
- Technical details identify affected sensors and recommended checks. Findings summarize the result; always inspect its plots, residuals and tables before reporting it.
| Finding | Appears on | When it appears | Severity |
|---|---|---|---|
| What was analyzed | Determine Kinetics, DEL, Concentration Determination | Always; its technical details list what was rejected or excluded | Info |
| No accepted kinetic result is available | Determine Kinetics, DEL | No fit was accepted | Warning |
| Fit quality | Determine Kinetics, DEL | Accepted fits exist | Info |
| Concentration | Determine Kinetics, DEL | KD falls outside the tested range, or the top concentration is too low to reach a plateau | Info |
| Main binding results | Determine Kinetics, DEL | Three or more accepted ligands, grouped by on/off-rate behavior | Info |
| Equilibrium suitability | Determine Kinetics | A 1:1 design check finds equilibrium unreachable in a fit | Warning / info |
| 1:1 fit design | Determine Kinetics | The concentration series is too narrow for a 1:1 fit | Warning / info |
| Association timing | Determine Kinetics | An association is too short, or saturates | Warning / info |
| Dissociation timing | Determine Kinetics | A dissociation is too short to read koff | Warning / info |
| Measurable kinetic range | Determine Kinetics | A rate or affinity falls outside the measurable range | Warning |
| Calibration coverage | Concentration Determination | Standards miss the plateau, or none can be assessed | Warning / info |
| Calibration range | Concentration Determination | A sensor or dilution group falls outside the fitted range | Warning |
| Automatic quality exclusions | Concentration Determination | Points were dropped automatically (non-finite or outliers) | Info |
| Dilution response compression | Concentration Determination | High-dose responses are compressed, a sign of saturation | Warning |
A result that has no saved finding evidence must be re-evaluated to produce this summary.
What each evaluation exports
Every artifact an evaluation produces is listed on its result page for download, and Download Evaluation Results in the row menu saves them together as one ZIP. The report PDF and the numeric table are the two most sent on; the HTML plots are interactive.
| Evaluation | Report | Numeric data | Plots (HTML) |
|---|---|---|---|
| Determine Kinetics | kinetic_report.pdf | kinetic_results.xlsx (per-ligand and per-sensor: KD (M), kon (1/M/s), koff (1/s), Rmax, Rmax Norm, Chi-Square) and kinetic_results.zip of the per-ligand fit data | median kinetics, sensor kinetics, on-off rate map, statistics, rejected fits, and per-ligand fit plots |
| DEL | report.pdf | the kinetics tables above, per accepted ligand | response, immobilization, sequence, per-sensor fit and off-rate plots |
| Equilibrium | equilibrium_report.pdf | k_d_summary.csv (sensor, ligand, analyte, KD) and fit_results.zip | fit matrix and overlays, per-sensor fits, the per-ligand KD boxplot, and normalized binding traces |
| Limit of Detection | lod_report.pdf | lod_values.csv (Analyte, Sensor, LOD Value in nM or %, LOD Signal in pg/mm², Model Name, Computation Date) | overlay, per-compound and per-sensor fit plots |
| Concentration Determination | — | concentration_statistics.csv (overall estimate, per-group contribution and 95% CI with inclusion status, and per-sensor weight share) | calibration curve, calibration and unknown traces, and the concentration boxplot |